Prometheus
CrowdSec can expose a prometheus endpoint for collection (on http://127.0.0.1:6060/metrics by default).
The goal of this endpoint, besides the usual resources consumption monitoring, aims at offering a view of CrowdSec "applicative" behavior :
- is it processing a lot of logs ? is it parsing them successfully ?
- are a lot of scenarios being triggered ?
- are a lot of IPs banned ?
- etc.
All the counters are "since CrowdSec start".
Metrics details#
Scenarios#
cs_buckets: number of scenario that currently existcs_bucket_created_total: total number of instantiation of each scenariocs_bucket_overflowed_total: total number of overflow of each scenariocs_bucket_underflowed_total: total number of underflow of each scenario (bucket was created but expired because of lack of events)cs_bucket_poured_total: total number of event poured to each scenario with source as complementary key
example
#2030 lines from `/var/log/nginx/access.log` were poured to `crowdsecurity/http-scan-uniques_404` scenariocs_bucket_poured_total{name="crowdsecurity/http-scan-uniques_404",source="/var/log/nginx/access.log"} 2030Parsers#
cs_node_hits_total: how many time an event from a specific source was processed by a parser node :
example
# 235 lines from `auth.log` were processed by the `crowdsecurity/dateparse-enrich` parsercs_node_hits_total{name="crowdsecurity/dateparse-enrich",source="/var/log/auth.log"} 235cs_node_hits_ko_total: how many times an event from a specific was unsuccessfully parsed by a specific parser
example
# 2112 lines from `error.log` failed to be parsed by `crowdsecurity/http-logs`cs_node_hits_ko_total{name="crowdsecurity/http-logs",source="/var/log/nginx/error.log"} 2112cs_node_hits_ok_total: how many times an event from a specific source was successfully parsed by a specific parsercs_parser_hits_total: how many times an event from a source has hit the parsercs_parser_hits_ok_total: how many times an event from a source was successfully parsedcs_parser_hits_ko_total: how many times an event from a source was unsuccessfully parsed
Acquisition#
cs_reader_hits_total: how many events were read from a specific source
Local API#
cs_lapi_route_requests_total: number of calls to each route per methodcs_lapi_machine_requests_total: number of calls to each route per method grouped by machinescs_lapi_bouncer_requests_total: number of calls to each route per method grouped by bouncerscs_lapi_decisions_ko_total: number of unsuccessfully responses when bouncers ask for an IP.cs_lapi_decisions_ok_total: number of successfully responses when bouncers ask for an IP.
Info#
cs_info: Information about CrowdSec (software version)
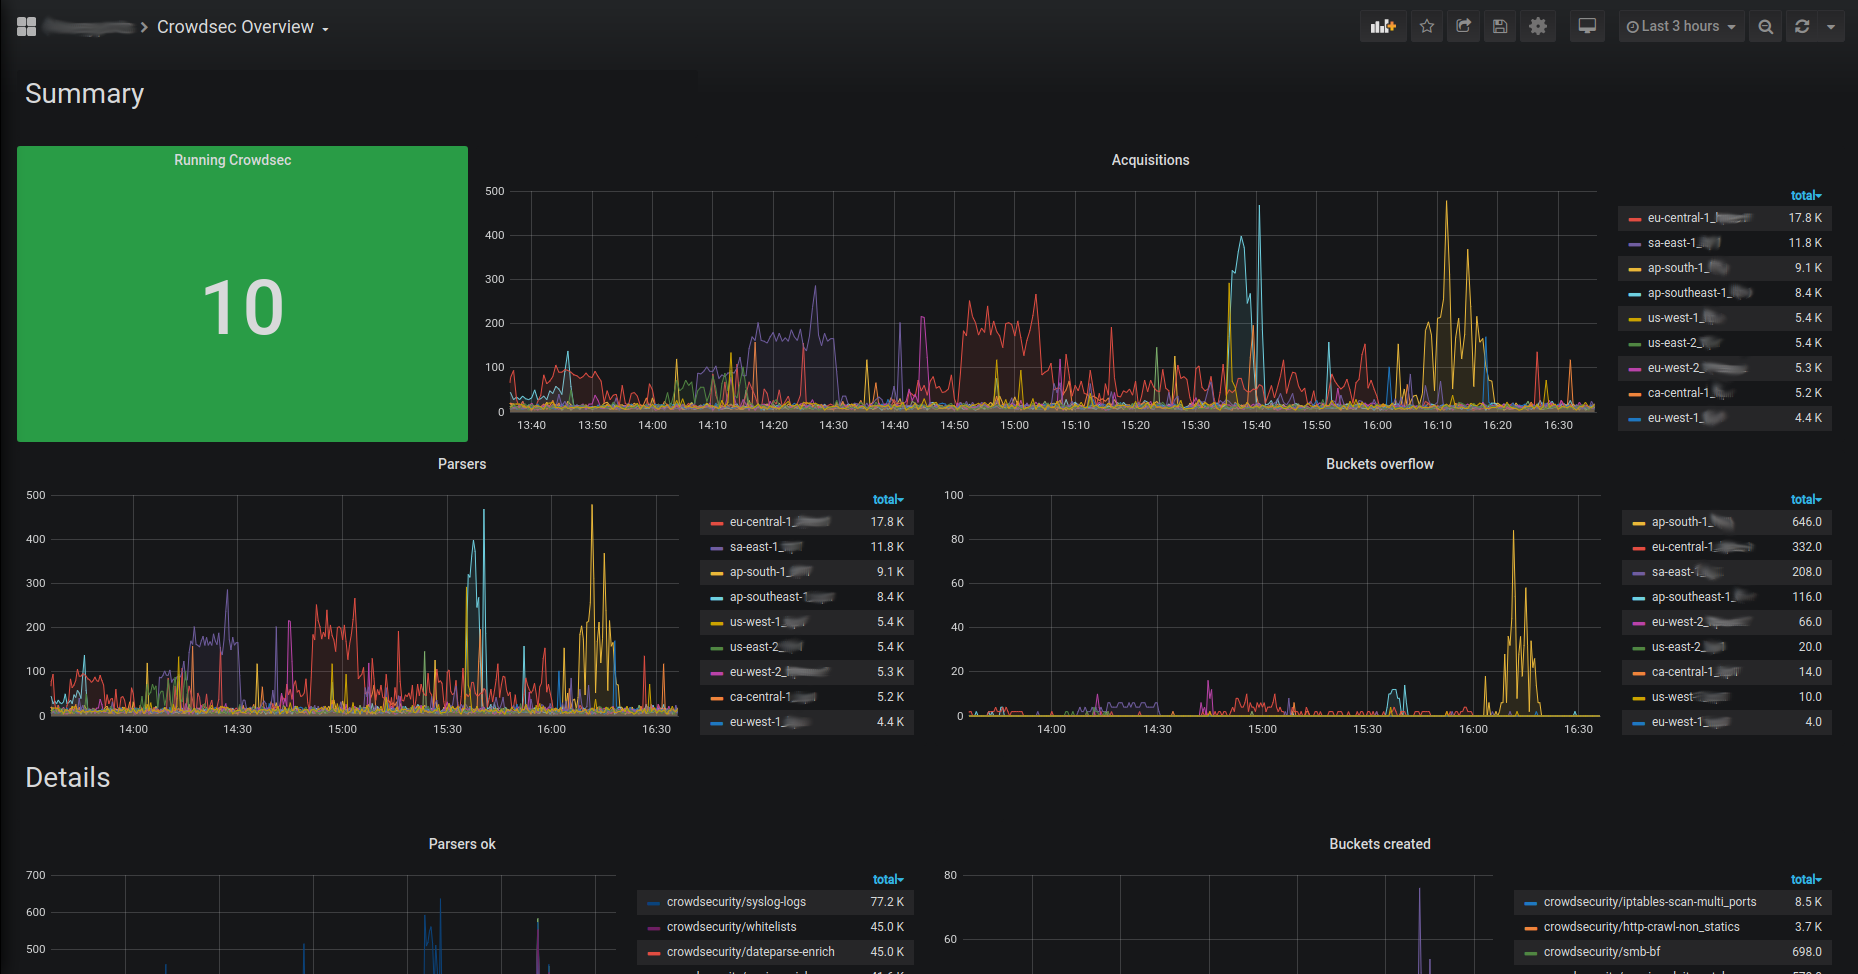
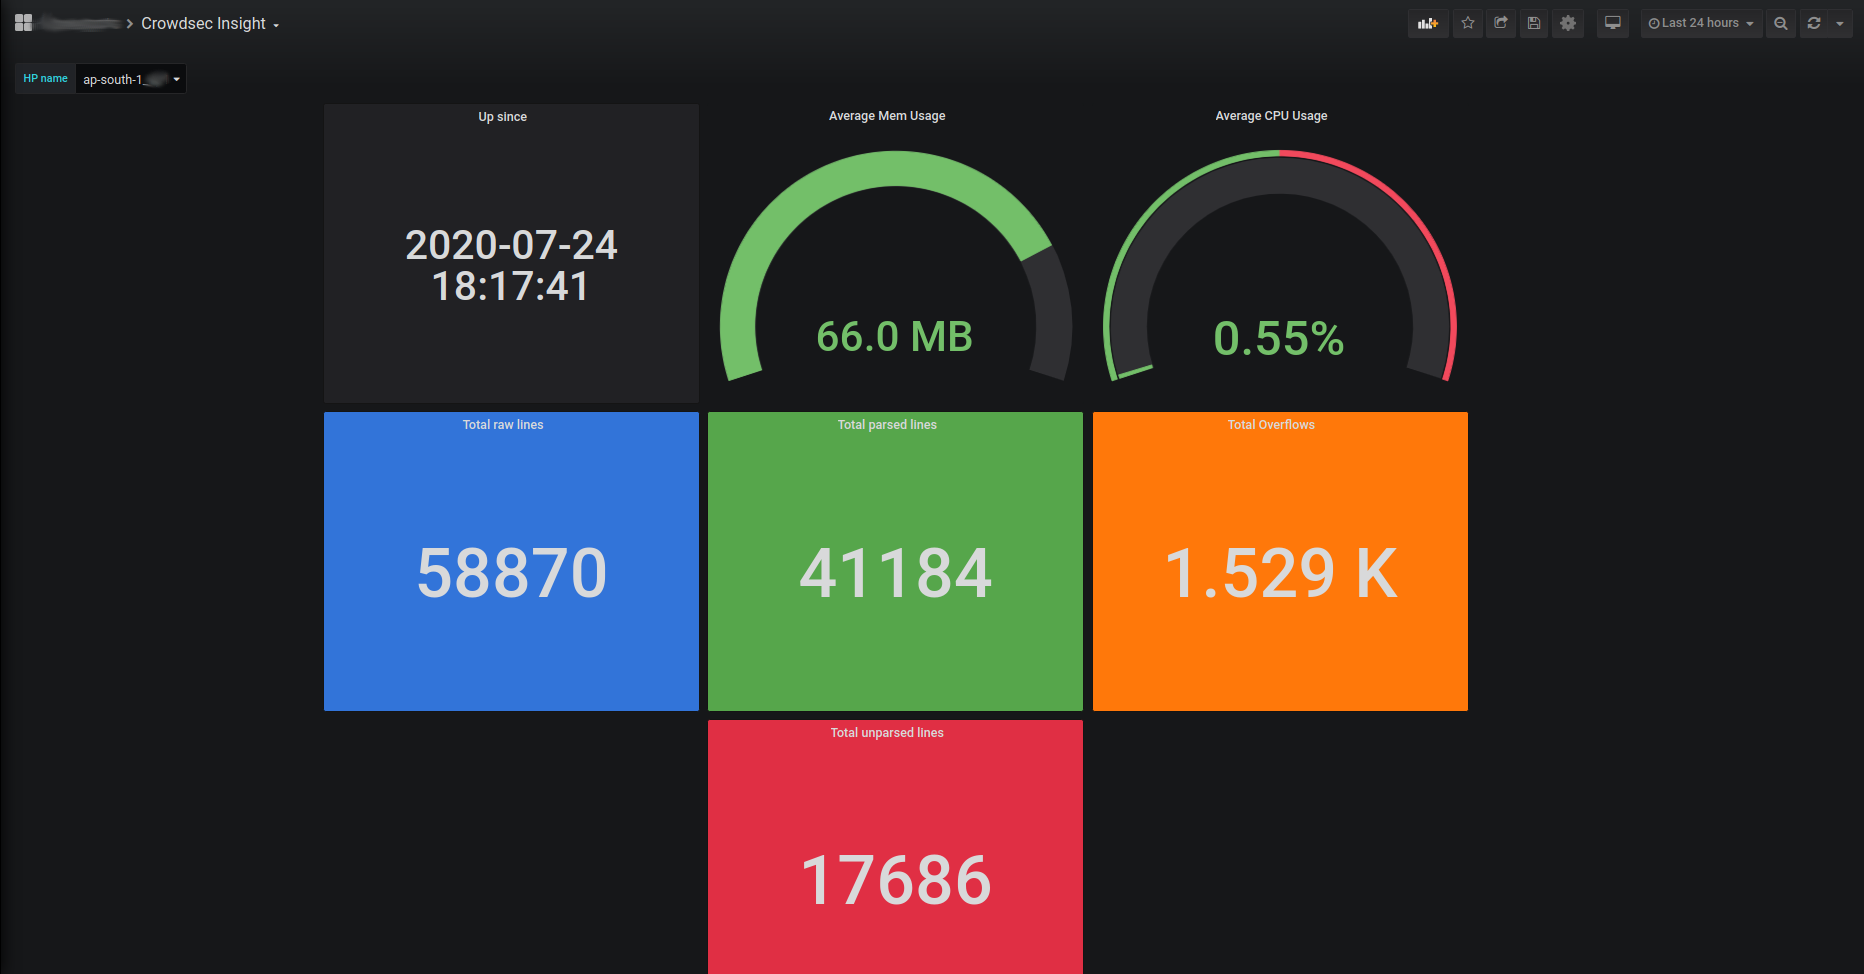
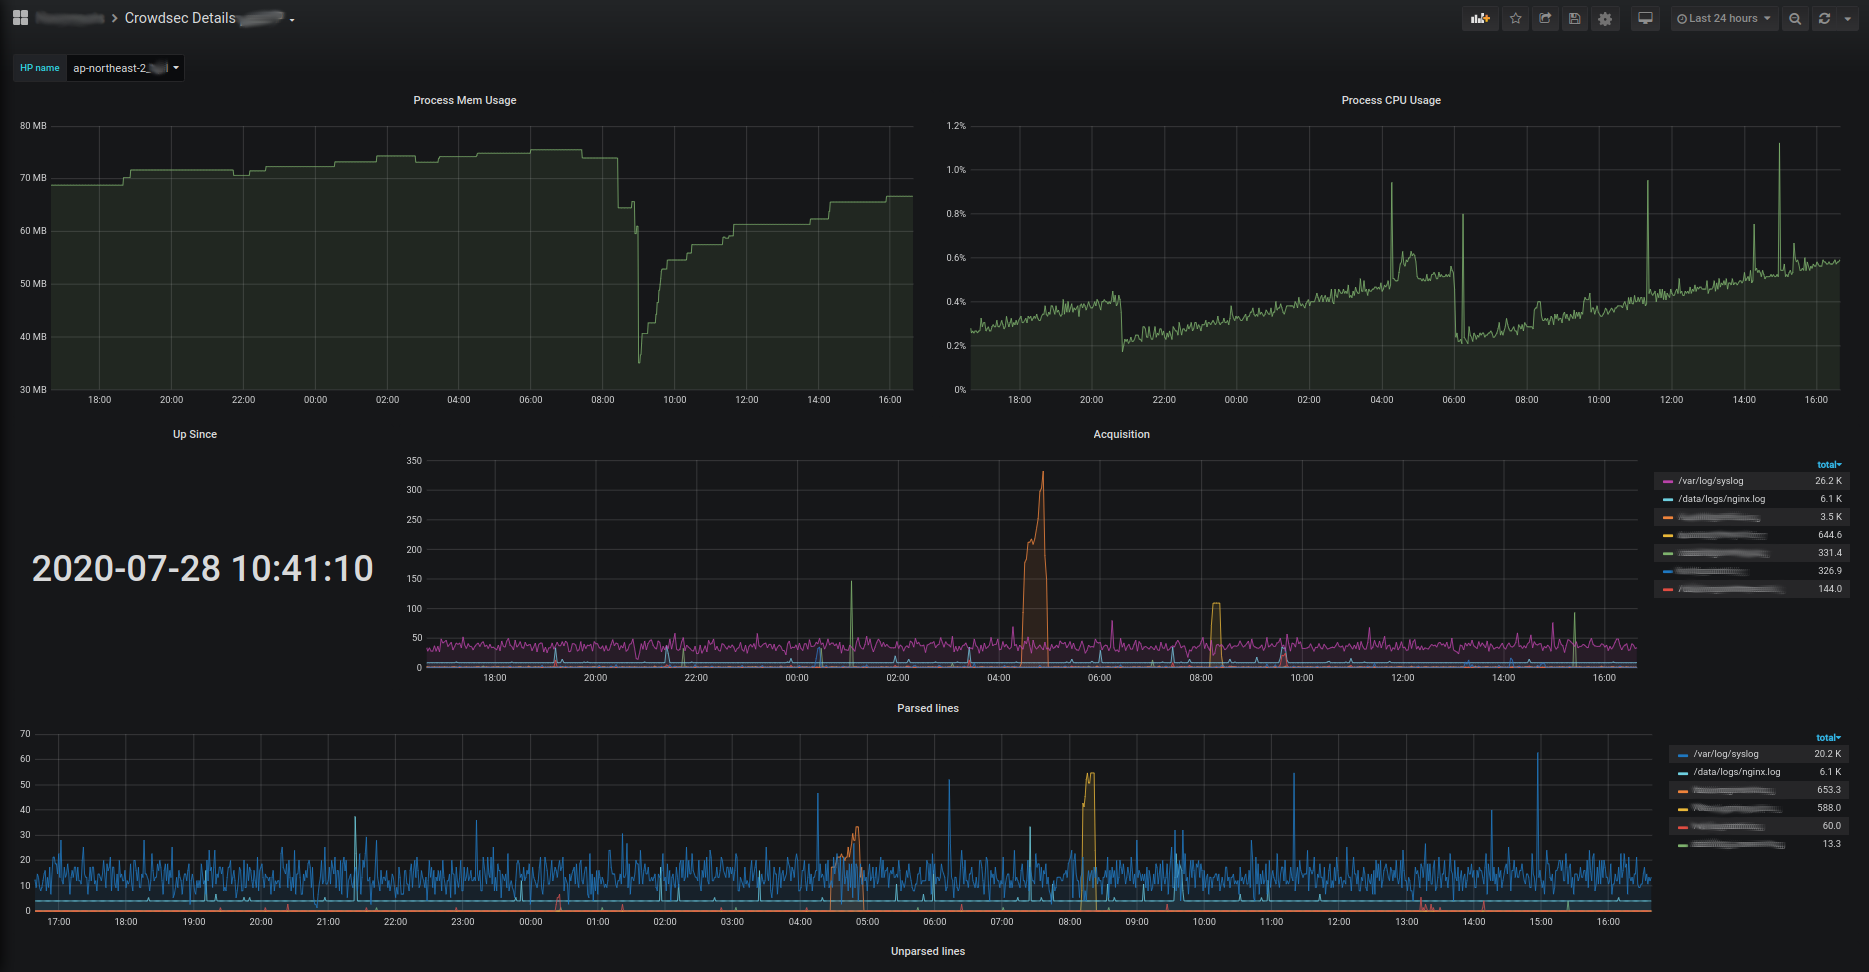
Exploitation with prometheus server & grafana#
Those metrics can be scaped by prometheus server and visualized with grafana. They can be downloaded here :